
Infographics & Visualisations
Clarity Through Visuals
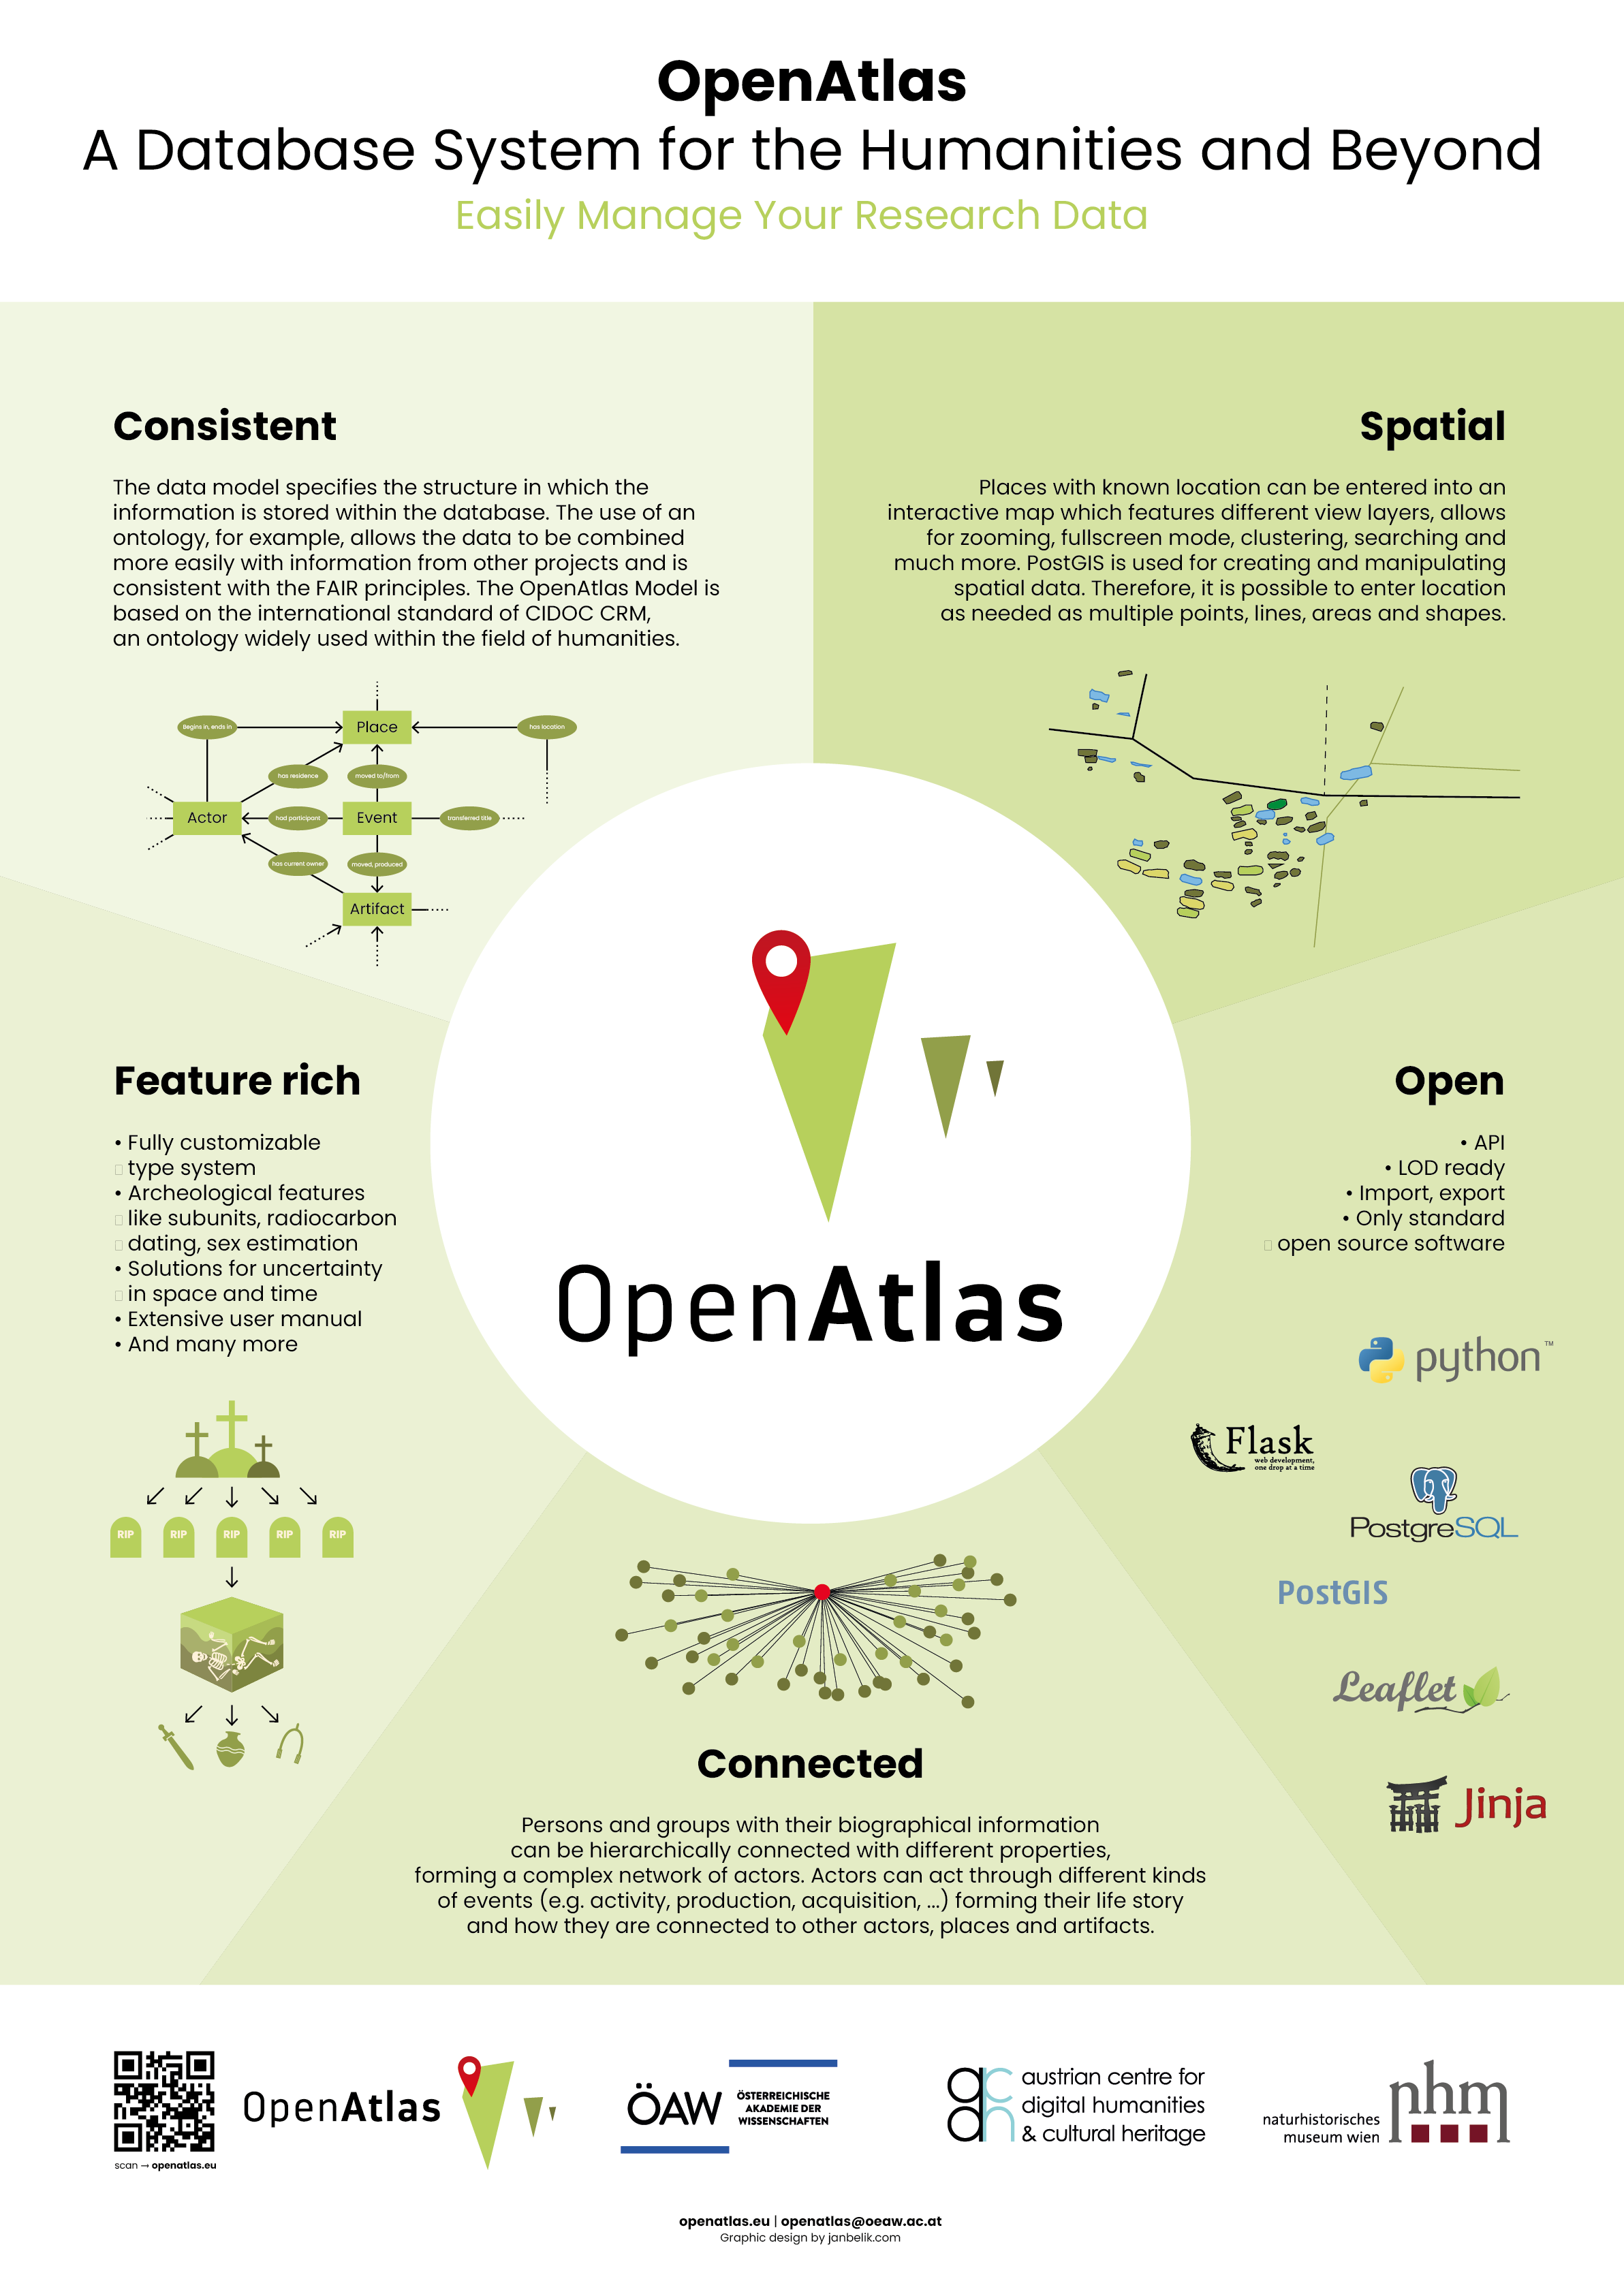
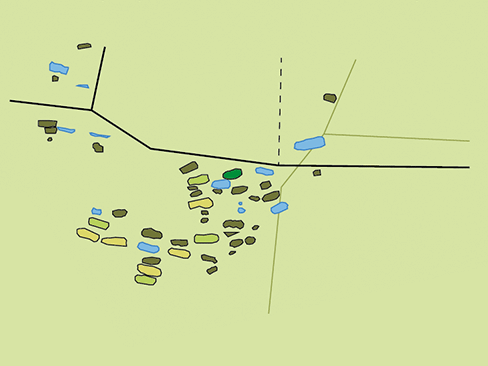
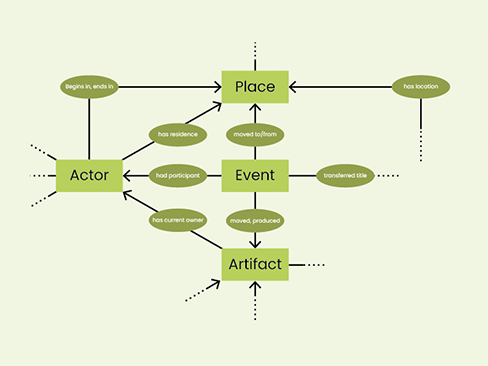
Complex data and research deserve more than just words. Infographics and informational design transform intricate scientific concepts into clearer, more engaging visuals that inform and hopefully inspire. Whether it’s mapping historical events, illustrating ecological systems, or breaking down molecular processes, well-crafted and data-driven graphics make information accessible without compromising accuracy. Let’s turn your research into visuals that captivate, educate, and leave a lasting impact.
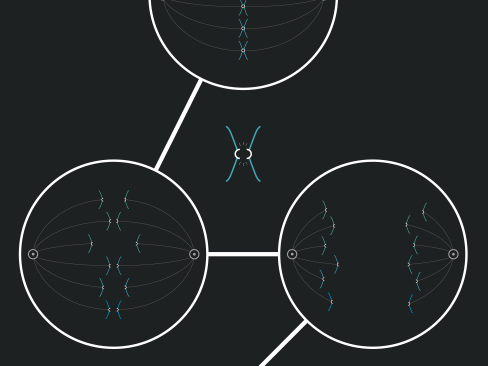
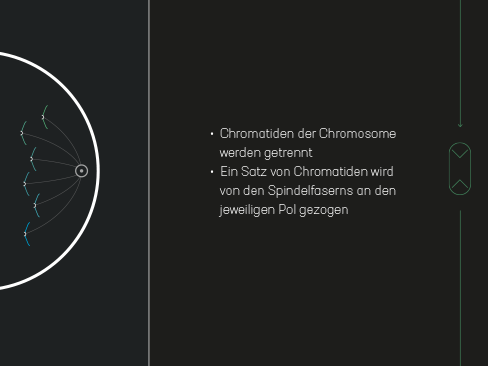
The Minimalist Mitosis Mechanism
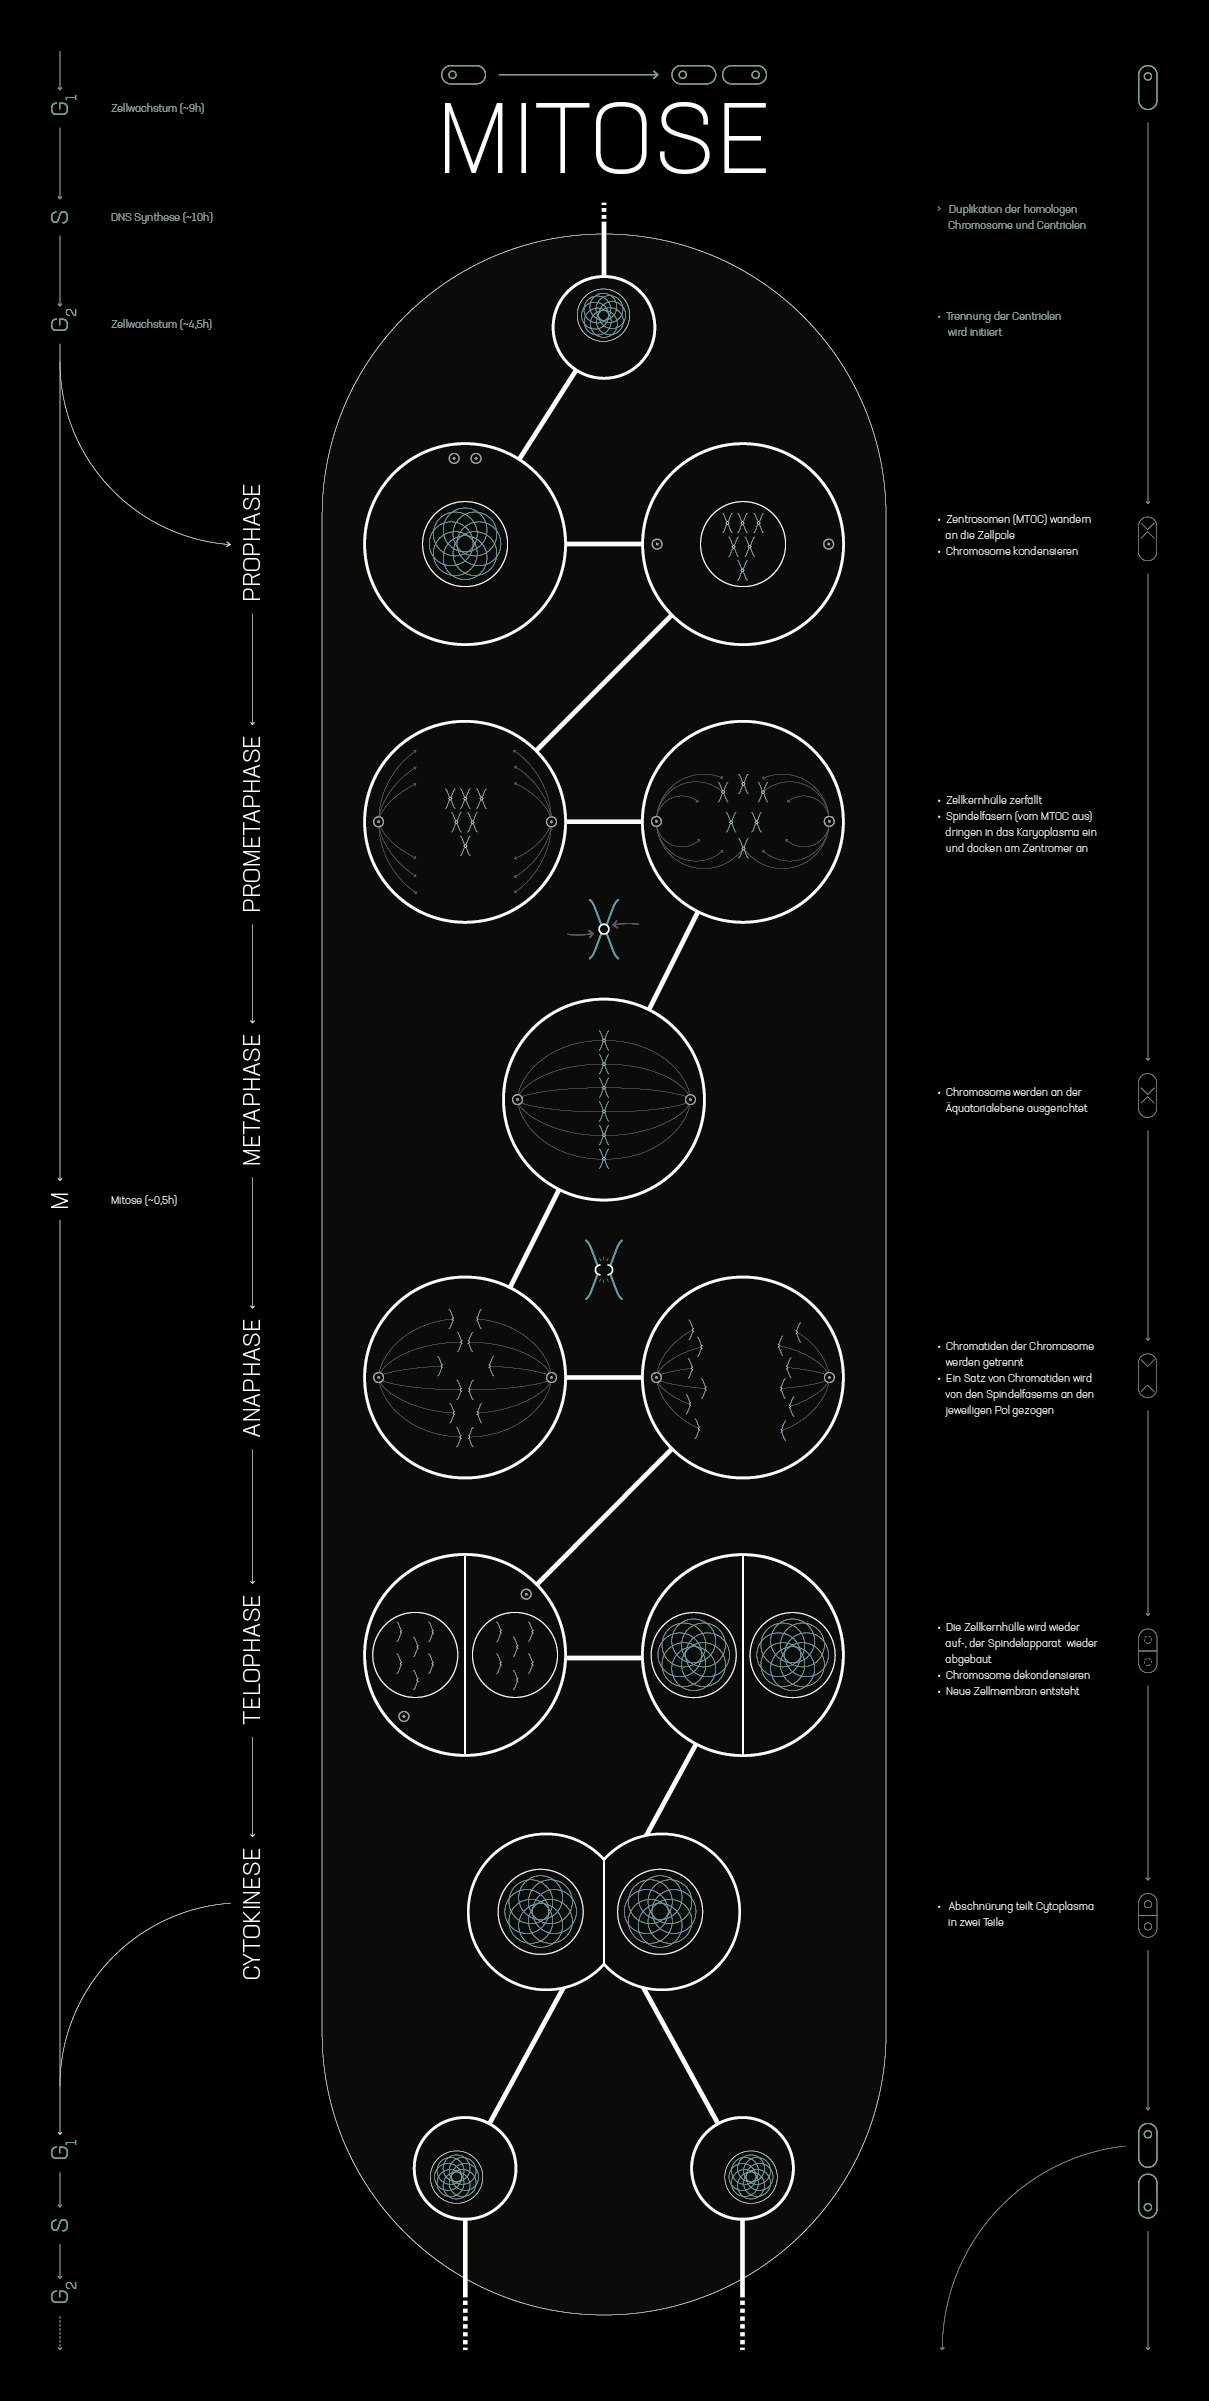
A clear, structured view of cell division. This minimalist infographic distills the mitosis process into clean, easily parsed visuals—illustrating each phase from prophase to cytokinesis. Subtle color differences and a sleek layout keep the focus on the essentials, making it easy to grasp mitosis at a glance without unnecessary visual clutter.
Art Direction
Graphic design
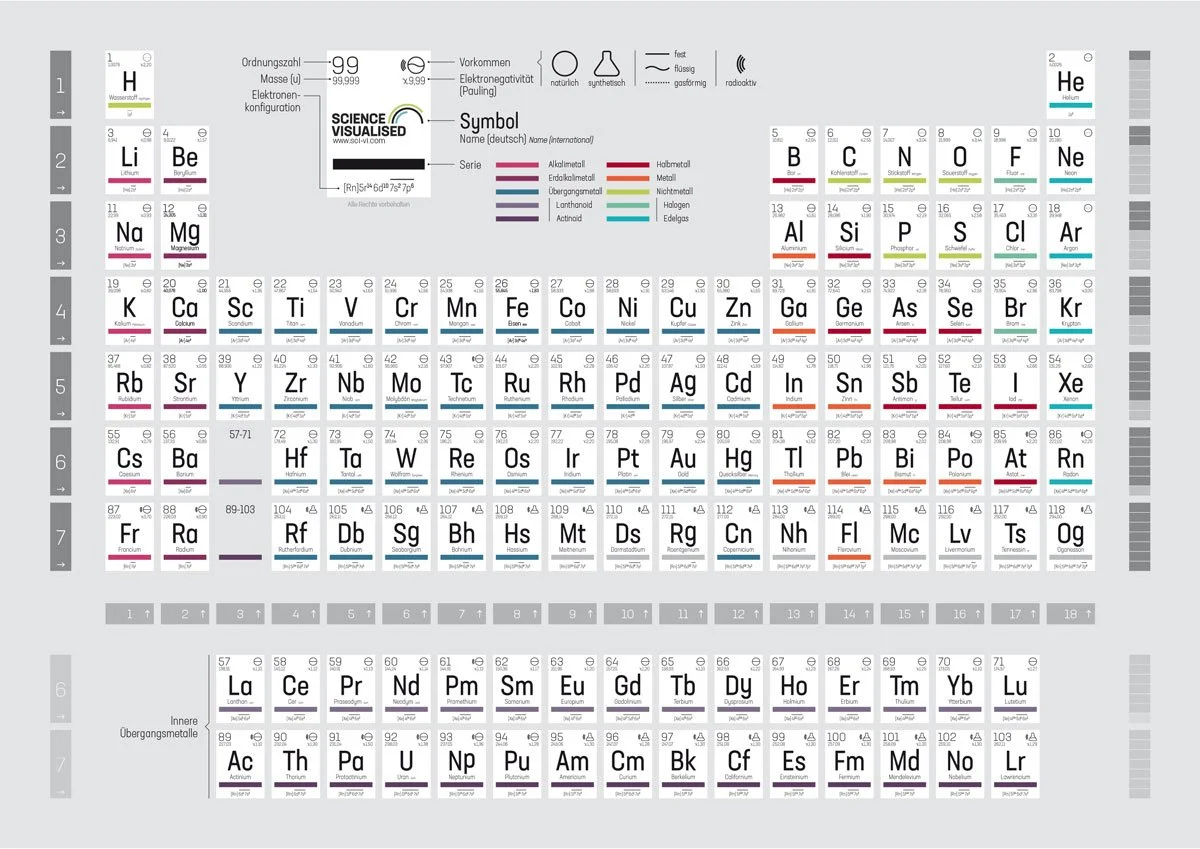
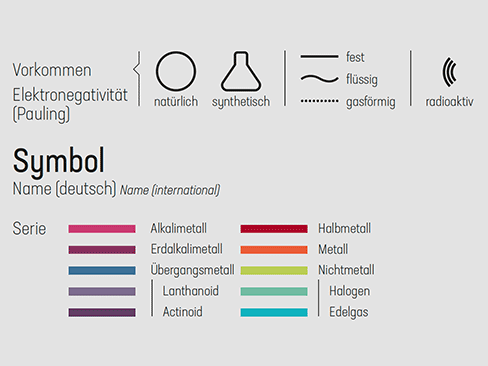
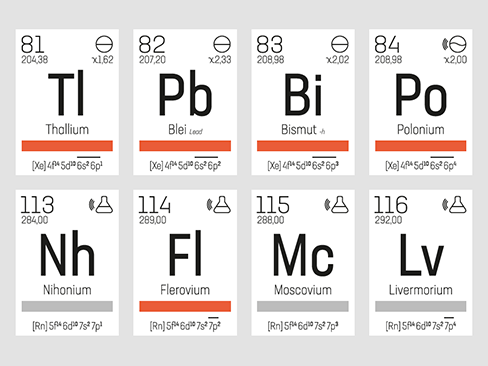
Periodic Table
A fresh take on a classic infographic. This design presents the elements with clean typography, balanced spacing, and a modern, distraction-free layout. Focused on clarity and readability, it makes chemical information instantly accessible.
Art Direction
Graphic design