
Science Visualised provides creative services to the scientific community.
We do what we can, so you can do what you love.
Branding
Recognition is an asset, wether you sell a product or compete for grants and funding. Take control of how your work is perceived and let your project or institution logos, publications and web design speak with one voice.
Infographic Design
Visually presenting research and data is fundamentally linked to a quick understanding – and something we absolutely love to do.
Graphic Design
When you want to get a point across – even more so if you want to get across several, and how they relate to each other - you want a concise, legible and interesting visual representation.
UI/UX-Design
Smooth interaction of humans with technology depends on a well designed user interface. That can be an easy to navigate website to present research or a tool for data entry.
Book & Editorial Design
Book covers, editorial graphics and infographics, layout and pre-press print preparation for books and articles. Single projects or recurring publications.
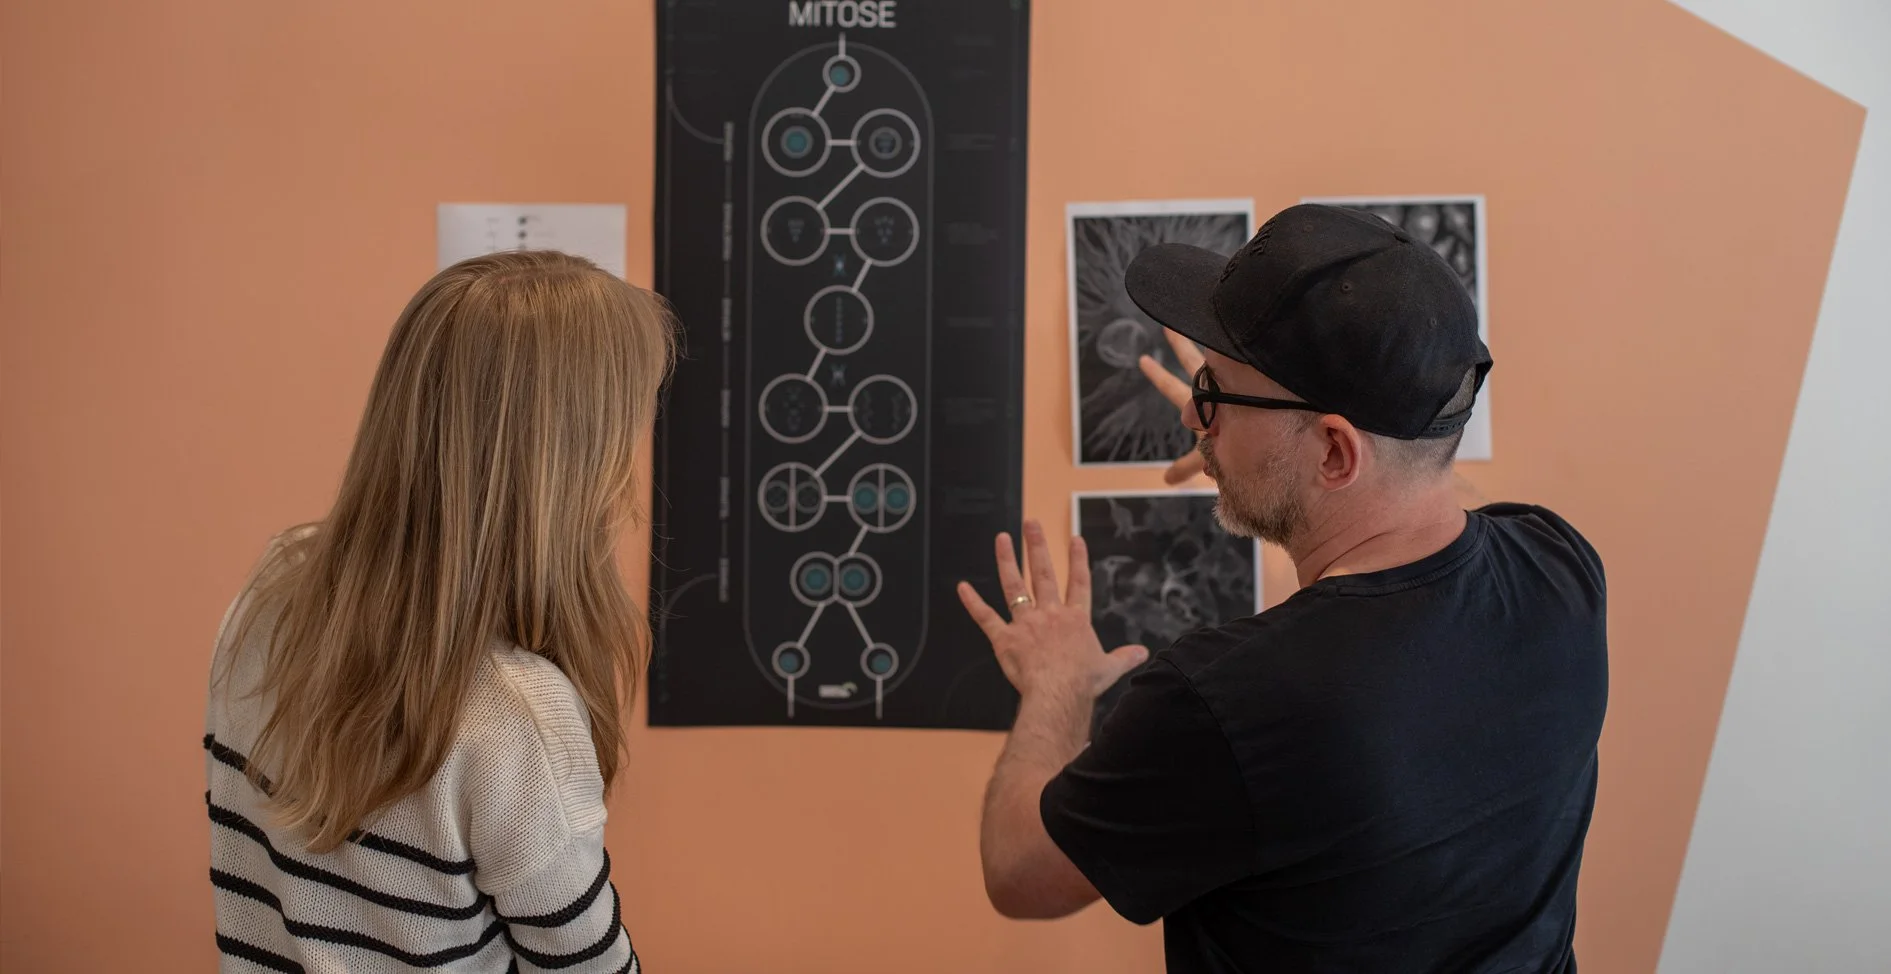
Consulting & Workshops
We’d love to give feedback on existing designs and help with design decisions in ongoing projects.
Bridging the gap between scientific research and visual aesthetics.
Branding – Visual Identity for Open-Source Research Software OpenAtlas